Folly Beach Had 9.5 Months of Homes for Sale a Year Ago. Now It Has 4.3
A Charleston market take from Heron Homes, built from the Charleston MLS on November 12, 2026.
The National Picture
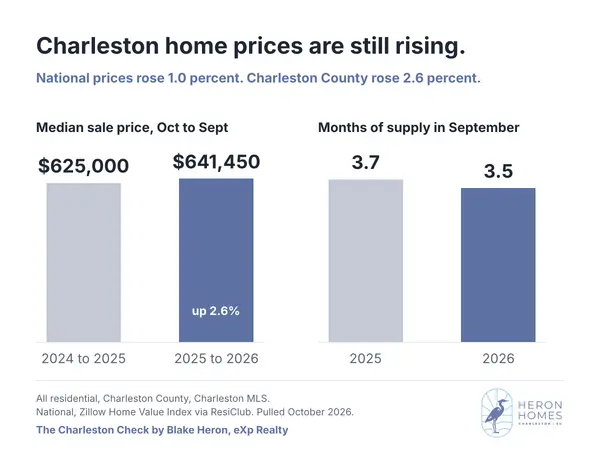
ResiClub, which tracks Realtor.com listings, reported on November 11 that active homes for sale across the country were up 7.6 percent in October compared with a year earlier. It is the fourth straight month that number has sped up. Charleston County looks different. In the Charleston MLS, active listings went from 2,369 to 2,246, a drop of 5.2 percent, while homes sold over 12 months rose from 7,401 to 7,821. These are two different data sources, so compare the direction, not the decimals. The country is filling up with homes for sale and Charleston County is not. The rest of this post shows where supply is tightest and where it is loosening.
What Months of Supply Means
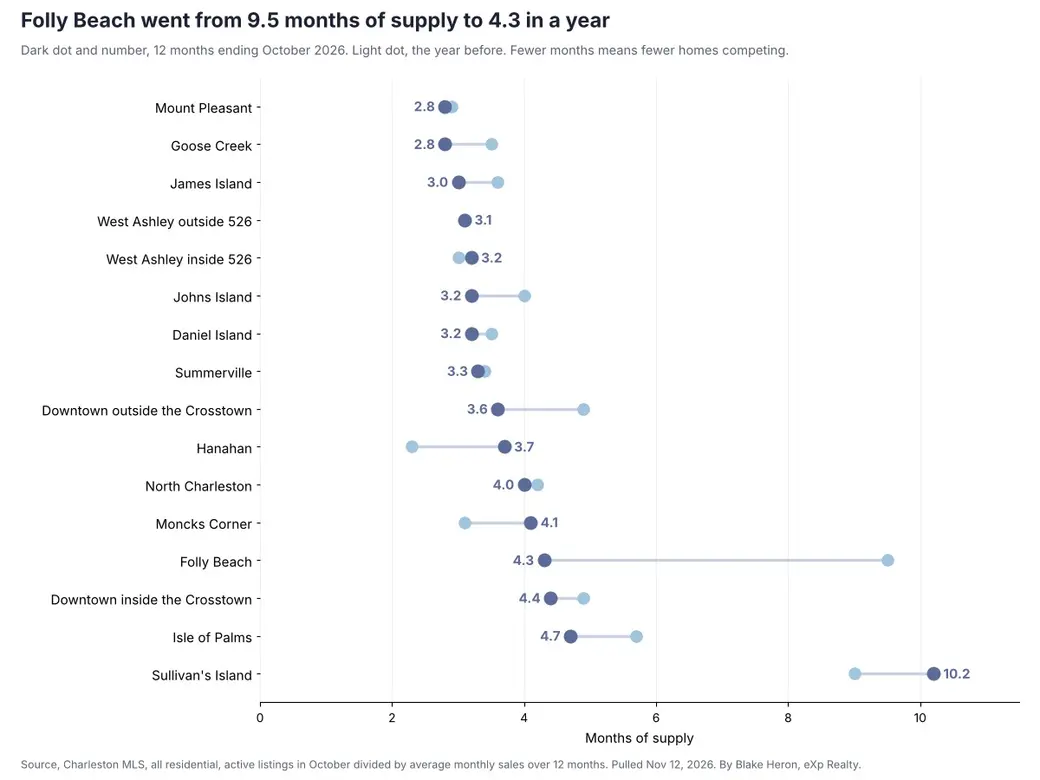
Months of supply is how long it would take to sell every home on the market if nothing new was listed. I take the active listings in October and divide by the average number of homes sold per month over the last 12 months. A low number means buyers are competing for a short list of homes. A high number means sellers are competing for buyers. Every number here is all residential, meaning houses, townhomes and condos, from the Charleston MLS, for the 12 months ending October 2026. The comparison is the same 12 months one year earlier.
The Numbers by Area
Charleston County sits at 3.4 months, down from 3.8 a year ago. Active listings went from 2,369 to 2,246 while homes sold over 12 months went from 7,401 to 7,821. Supply got tighter in 11 of the 16 areas I track.
- Mount Pleasant, 2.8 months, was 2.9
- Goose Creek, 2.8 months, was 3.5
- James Island, 3.0 months, was 3.6
- West Ashley outside 526, 3.1 months, was 3.1
- Johns Island, 3.2 months, was 4.0
- West Ashley inside 526, 3.2 months, was 3.0
- Daniel Island, 3.2 months, was 3.5
- Summerville, 3.3 months, was 3.4
- Downtown outside the Crosstown, 3.6 months, was 4.9
- Hanahan, 3.7 months, was 2.3
- North Charleston, 4.0 months, was 4.2
- Moncks Corner, 4.1 months, was 3.1
- Folly Beach, 4.3 months, was 9.5
- Downtown inside the Crosstown, 4.4 months, was 4.9
- Isle of Palms, 4.7 months, was 5.7
- Sullivan's Island, 10.2 months, was 9.0
Where It Changed Most
Folly Beach is the biggest move. A year ago there were 71 homes for sale on Folly. In October there were 37, a drop of 48 percent, while sales over 12 months went from 90 to 103. That cut supply from 9.5 months to 4.3.
Johns Island went from 4.0 months to 3.2, and James Island went from 3.6 to 3.0. Mount Pleasant and Goose Creek share the lowest number at 2.8 months. Goose Creek got there from 3.5 a year ago, with 185 homes for sale in October against 222 a year earlier.
Hanahan and Moncks Corner moved the most in the other direction. Hanahan went from 2.3 months to 3.7 as sales fell from 324 to 246. Moncks Corner went from 3.1 to 4.1 as sales fell from 1,126 to 894.
Sullivan's Island stands alone at 10.2 months. There were 33 homes for sale in October and 39 sold in the last 12 months. With counts that small the number swings, and it was 9.0 months a year ago too.
What It Means for Sellers
In Mount Pleasant and Goose Creek, under 3 months of supply means a well priced home has little competition, and James Island is right behind at 3.0. On Folly Beach you are up against about half as many listings as a year ago. On Sullivan's Island, in Hanahan and in Moncks Corner, buyers have more to choose from, so price and condition decide who gets the offer. If you are thinking about selling, start on the Sell page.
What It Means for Buyers
Supply tells you how much room you have in an offer. Under 3 months, the good homes do not wait, and asking for a long list of concessions can cost you the house. Around 4 months and up, like North Charleston, Moncks Corner, Downtown inside the Crosstown and Isle of Palms, you have more time and more ground to ask for repairs or a lower price. At 10 months on Sullivan's Island, a seller who has been waiting may listen to an offer they would have turned down last year. Median prices for every area are on the Charleston home prices by area page.
Ask Blake
If you want the supply number for your neighborhood or your price range, call or text Blake Heron at 843-718-6338. I will pull it from the MLS the same day.
Source, Charleston MLS, all residential, 12 months ending October 2026 compared with 12 months ending October 2025, pulled November 12, 2026. By Blake Heron, eXp Realty.
GET MORE INFORMATION